TableLens
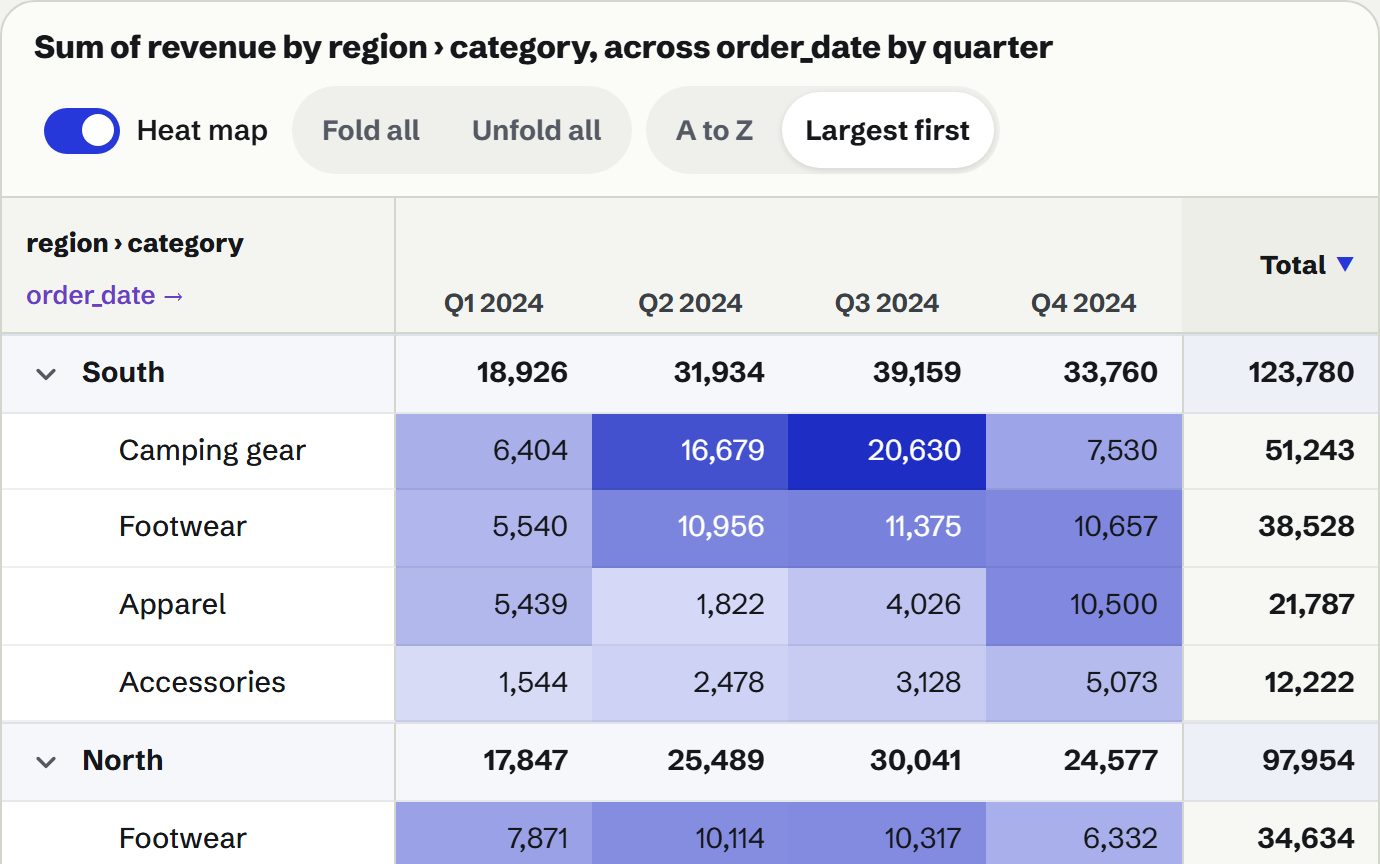
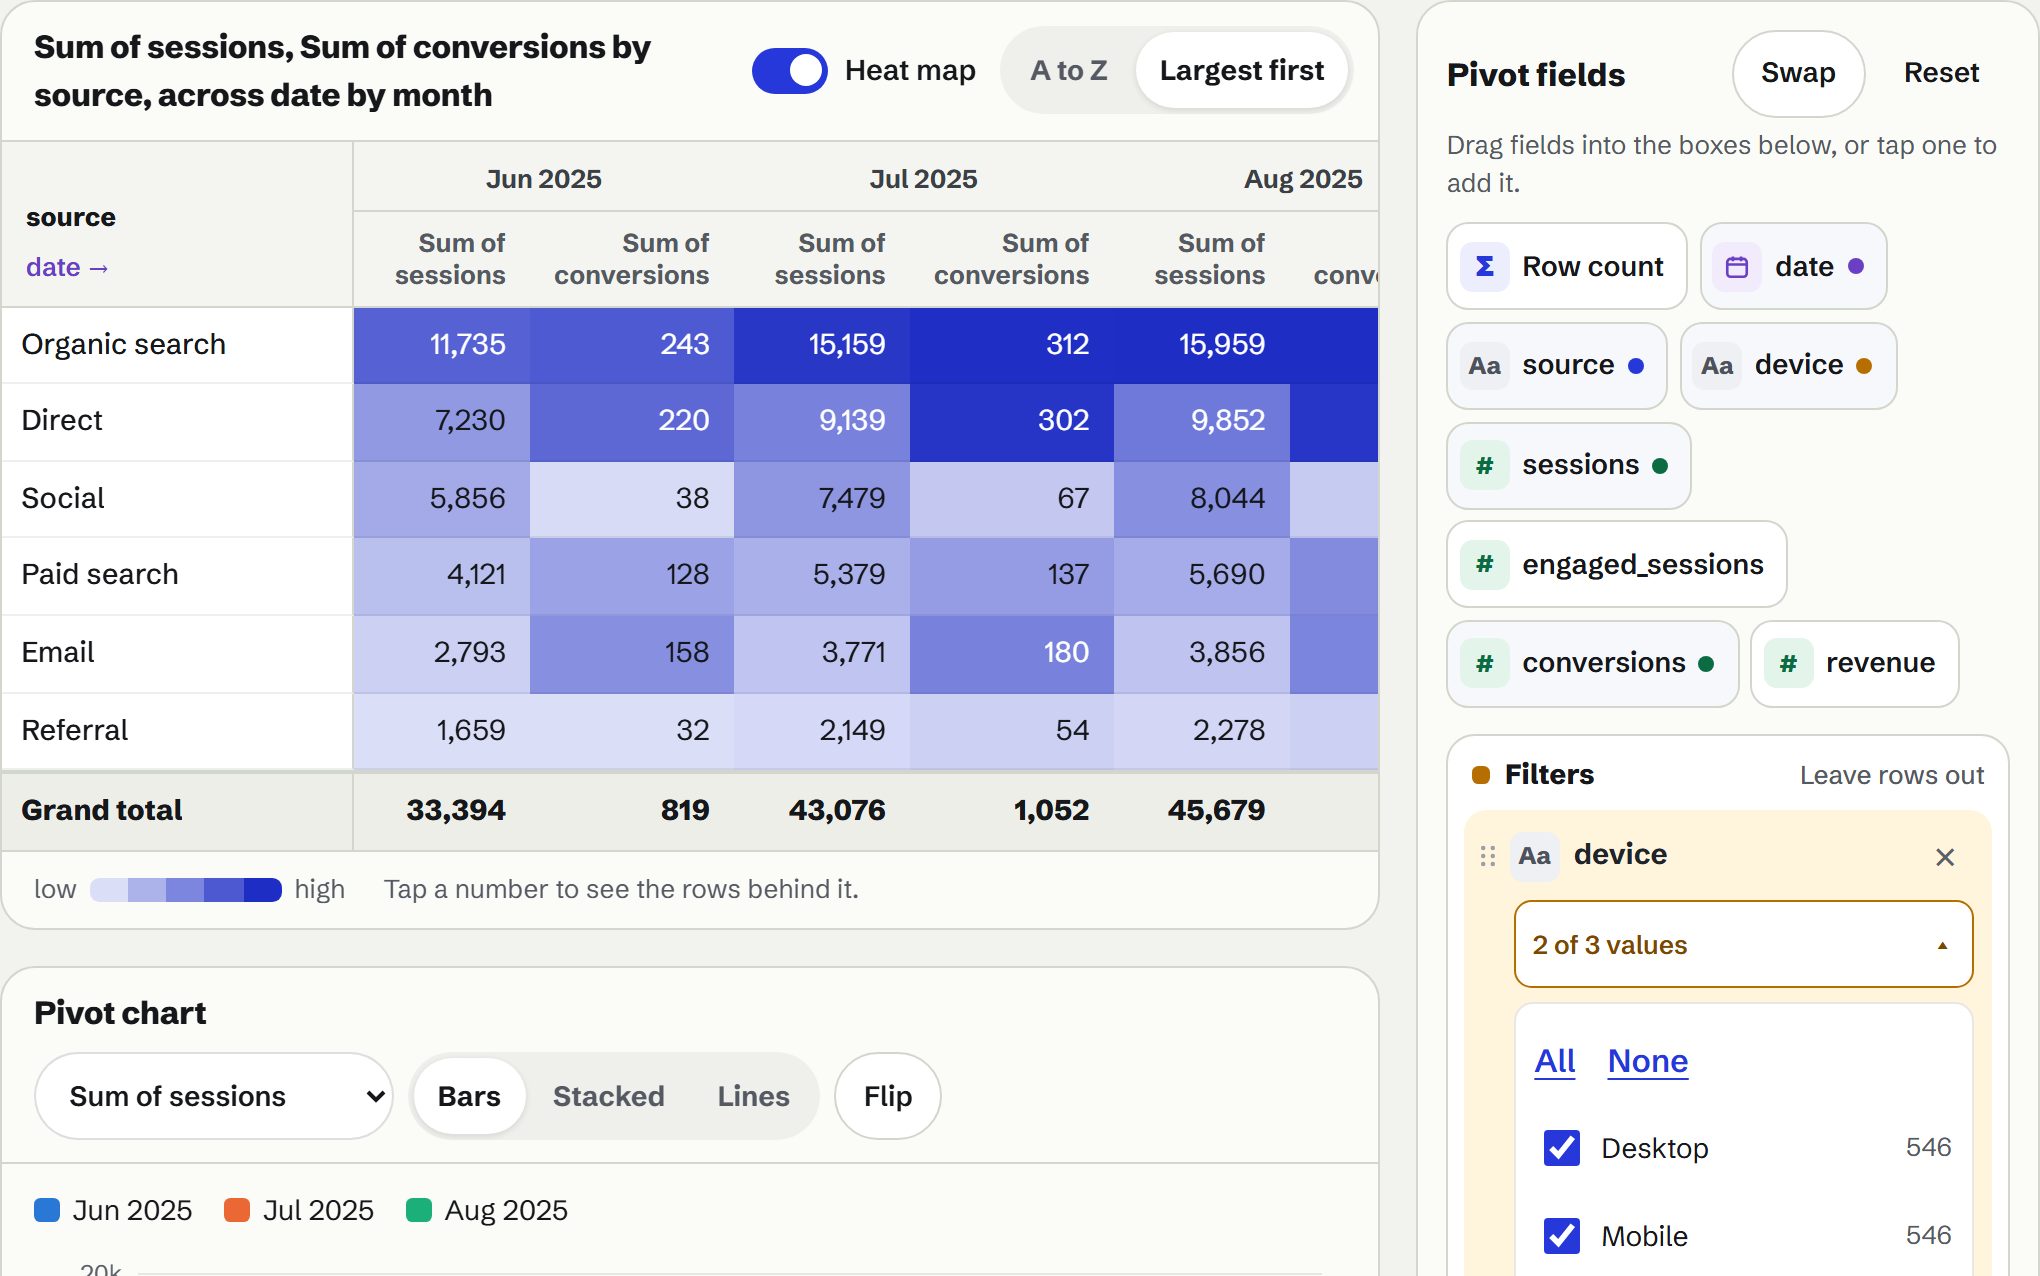
Drag fields into rows, columns and values to group, add up, count or average, with subtotals, a heat map, shares and a chart. Tap any number to see the rows behind it, and export the pivot table.
Runs in this tab. Nothing is uploaded. Keeps working if your connection drops.
Make a pivot table
Choose or drop a spreadsheetCSV, TSV or Excel. It stays on this device.
Or try a sample
Samples are made up and generated in your browser. No real people, shops or sites.
- The first row should hold the column names. Excel files: pick the sheet after opening.
- Dates are recognised when written year first, like 2024-03-07 or 2024/3/7.
- CSV in UTF-8, Windows-1252 and other encodings, with commas, semicolons, tabs or pipes, and decimal commas (1.234,50) detected per column. Excel files are read by their stored values, not the rounded ones shown.
- Everything happens in this tab’s memory, in the background: a million rows take a few seconds on a laptop, but very large files (hundreds of MB) can be slow or fail, especially on phones.
What it does
- Drag and drop, like a spreadsheetPut fields in Rows, Columns, Values and Filters, and nest as many row groups as you like.
- Every kind of totalSum, count, average, min, max, median and distinct count, several at once, with subtotals at each level.
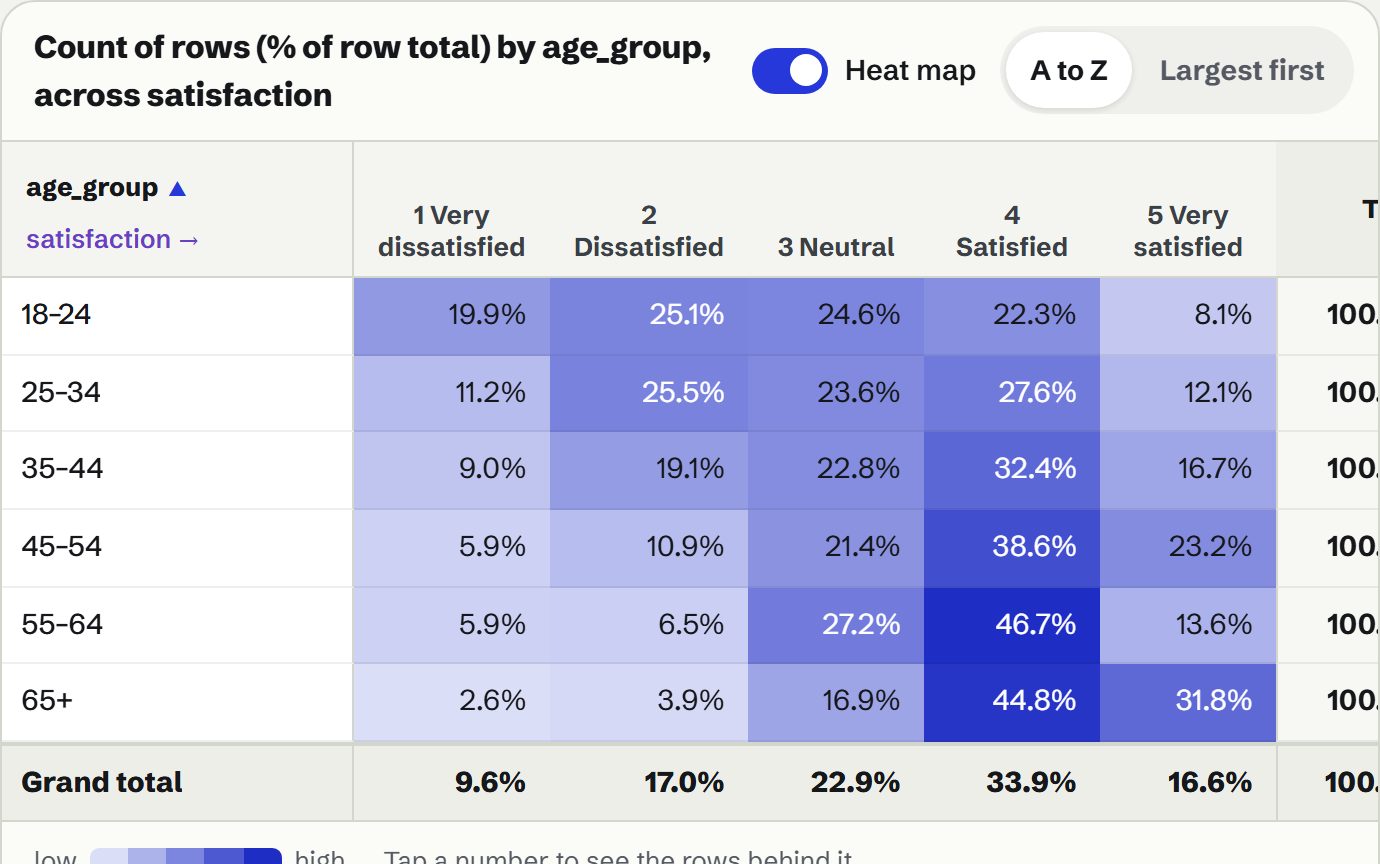
- Shares, not just sumsShow any value as a percentage of its row, its column or the grand total.
- Dates grouped for youDate columns roll up by year, quarter, month, ISO week or day.
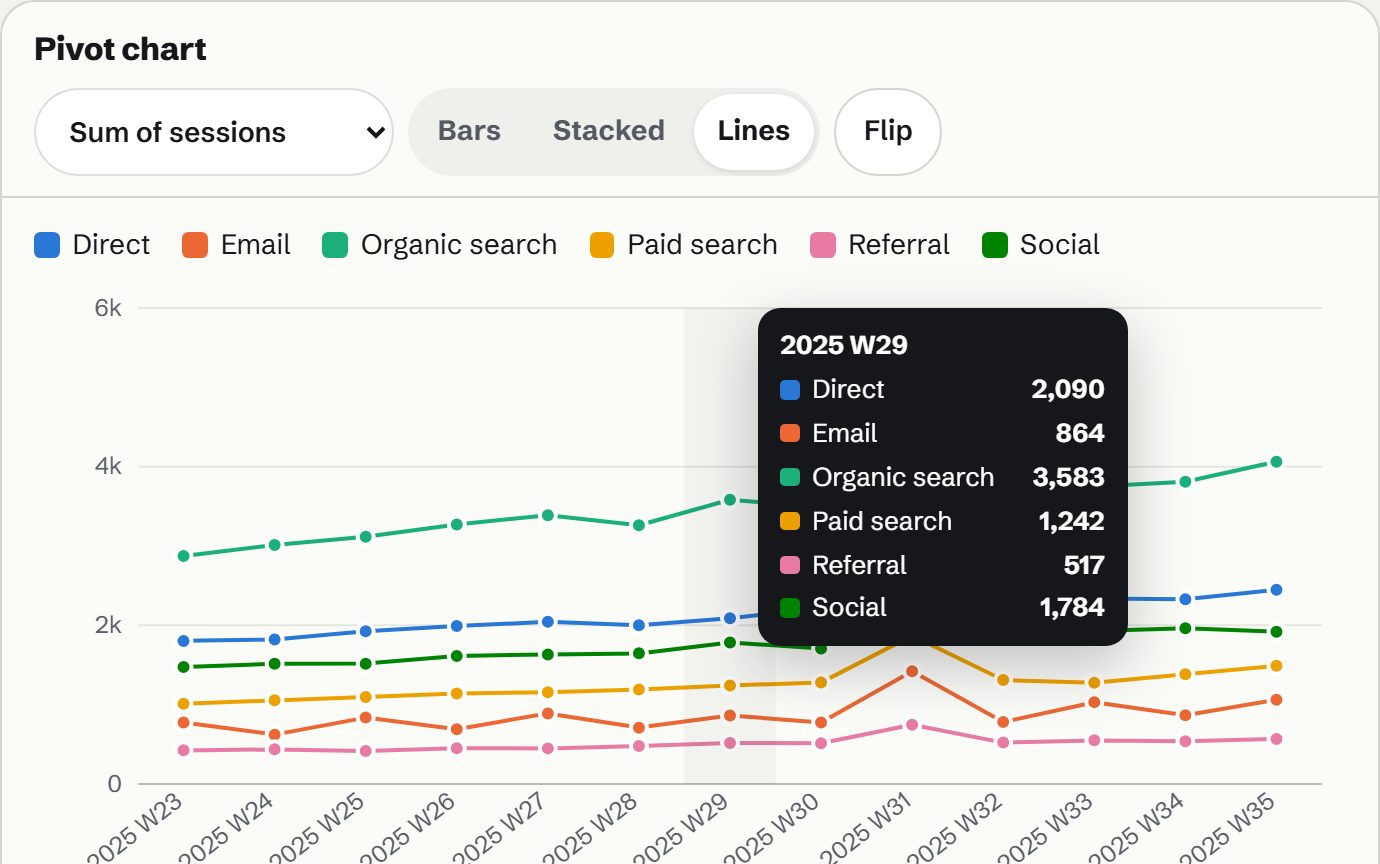
- See the patternA heat map on the cells, and a bar, stacked or line chart that follows the pivot.
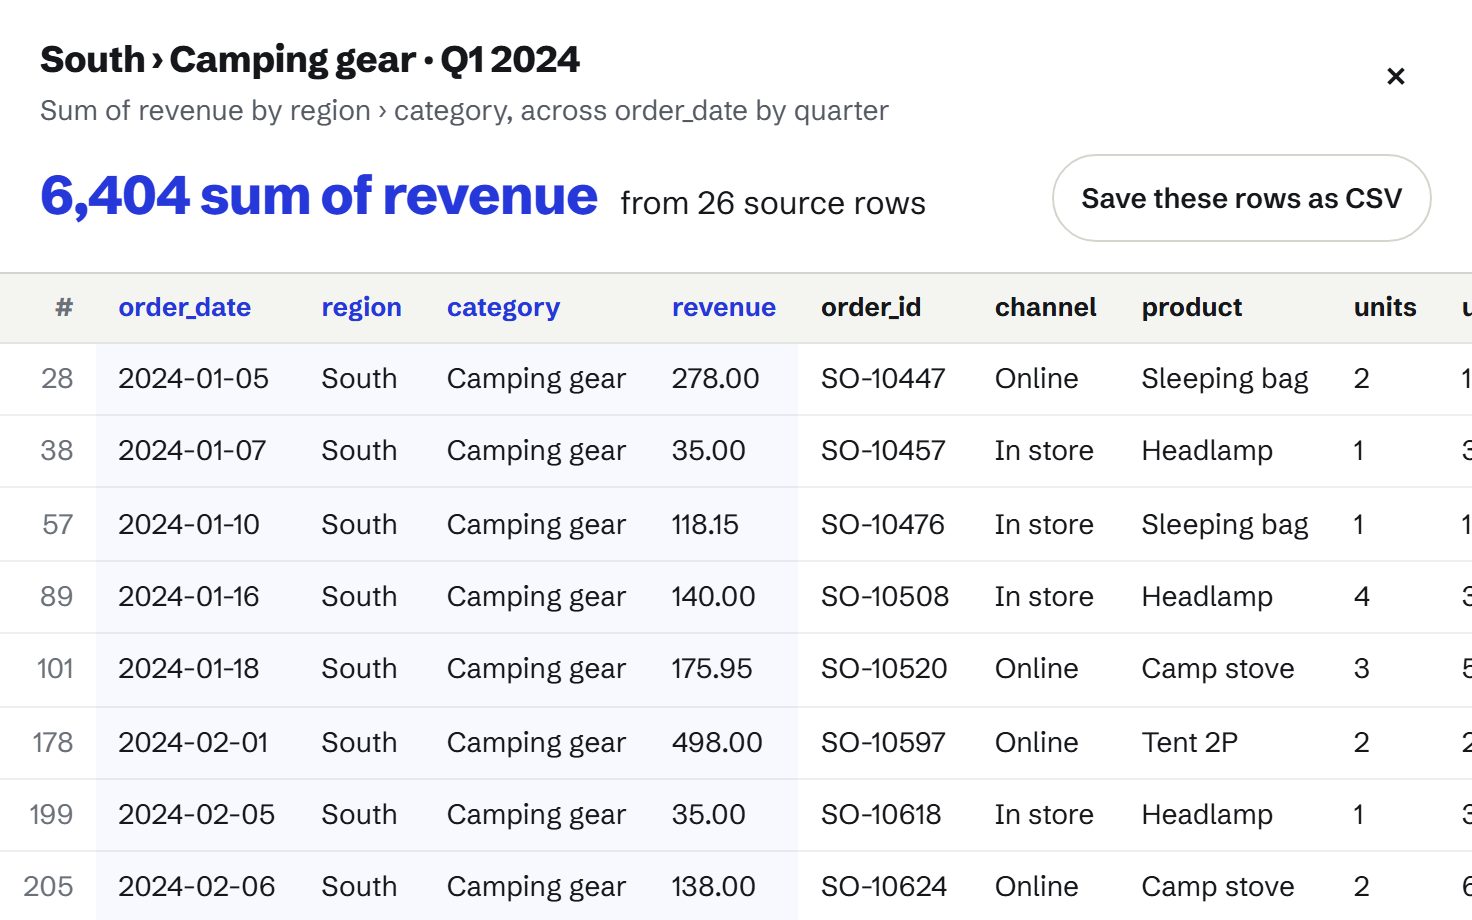
- The rows behind a numberTap any cell to see the source rows that make it up, and save them.
- Take it with youSave the pivot as an Excel file, CSV or Markdown, or copy it.